
We offer an intensive 3-month Data Analytics training course designed to equip participants with the skills needed to analyze, visualize, and interpret data effectively. The program covers the complete analytics workflow, including data collection, cleaning, exploration, and visualization using tools like Python, SQL, Power BI, and Excel. Participants gain hands-on experience in statistical analysis, exploratory data analysis (EDA), and business intelligence through real-world projects and case studies. Located in Trivandrum, Trinity Technologies is Kerala’s leading IT training institute, renowned for providing high-quality Data Analytics education that prepares learners for successful careers in data analysis, business intelligence, and data-driven decision-making across various industries.


01
Definition and scope of Data Science
Importance and applications of Data Science in various industries
Overview of Data Science vs Data Analytics vs Business Analytics
Definition and objectives of Data Analysis
Role of a Data Analyst
Real-world use cases of Data Analysis
Data vs Information vs Insights
02
Role of Python in Data Analysis
Types of Analytics: Descriptive, Diagnostic, Predictive, Prescriptive (overview only)
Data Analytics Life Cycle (Collection → Cleaning → EDA → Visualization → Insights)
Tools used in Python-based Data Analytics (NumPy, Pandas, Matplotlib, Seaborn, Plotly, SciPy, Statsmodels)
03
Set up Python, Jupyter Notebook, and libraries
Your first analysis: summarize a small CSV dataset
04
Data and Data Types
Structured Data: Tabular data, relational databases, spread sheets
Unstructured Data: Text, Images, Audio, Video, Time-series
05
CSV, Excel, JSON, XML, TXT
Image formats: JPG, PNG, TIFF
Audio/Video formats: MP3, WAV, MP4
Time-series data formats (timestamps, sensor readings, stock prices)
APIs, Web scraping basics, CSV/Excel imports
Introduction to publicly available datasets
06
Read different data formats in Python using Pandas (read_csv, read_json, read_excel)
Explore unstructured data like text and images (basic loading and inspection)
Identify data type and format in sample datasets
07
Python basics: Variables and Operators
Data types in Python
Strings, Integers, Floats, Booleans
Lists, Tuples, Dictionaries, Sets
DataFrames and Series in Pandas
Conditional statements & Loops
Functions, Lambda expressions, List comprehensions
Working with Lists, Tuples, Dictionaries, Sets
File handling (CSV, TXT, JSON, Excel)
Modules, Libraries, and Package installation (pip, virtual environments)
Error handling and debugging
08
Introduction to NumPy arrays
Array creation, indexing, slicing
Vectorization and broadcasting
Mathematical operations (mean, std, sum, dot, etc.)
Random number generation
Reshaping and stacking arrays
09
Read and process data files
Build mini programs for data filtering and transformation
Create numerical datasets and perform vectorized operations
Apply matrix operations to data problems
10
Pandas DataFrame and Series
Reading/writing data (CSV, Excel)
Selecting, filtering, sorting data
Handling missing values and duplicates
String and datetime operations
GroupBy, merge, join, concat operations
Data reshaping (melt, pivot, stack, unstack)
Apply(), map(), applymap() functions
11
Introduction to Data Visualization & Importance
Matplotlib
Line, Bar, Scatter, Histogram, Pie, Box plots
Customizing plots (titles, labels, grid, legends)
Seaborn
Distribution plots, Pair plots, Heatmaps, Violin plots, Count plots
Styling and themes
Plotly
Interactive charts and dashboards
Geo and time-series visualization
12
Clean and transform messy datasets
Combine multiple datasets into one structured DataFrame
Compare data trends using Seaborn & Plotly
Create storytelling visuals for datasets
13
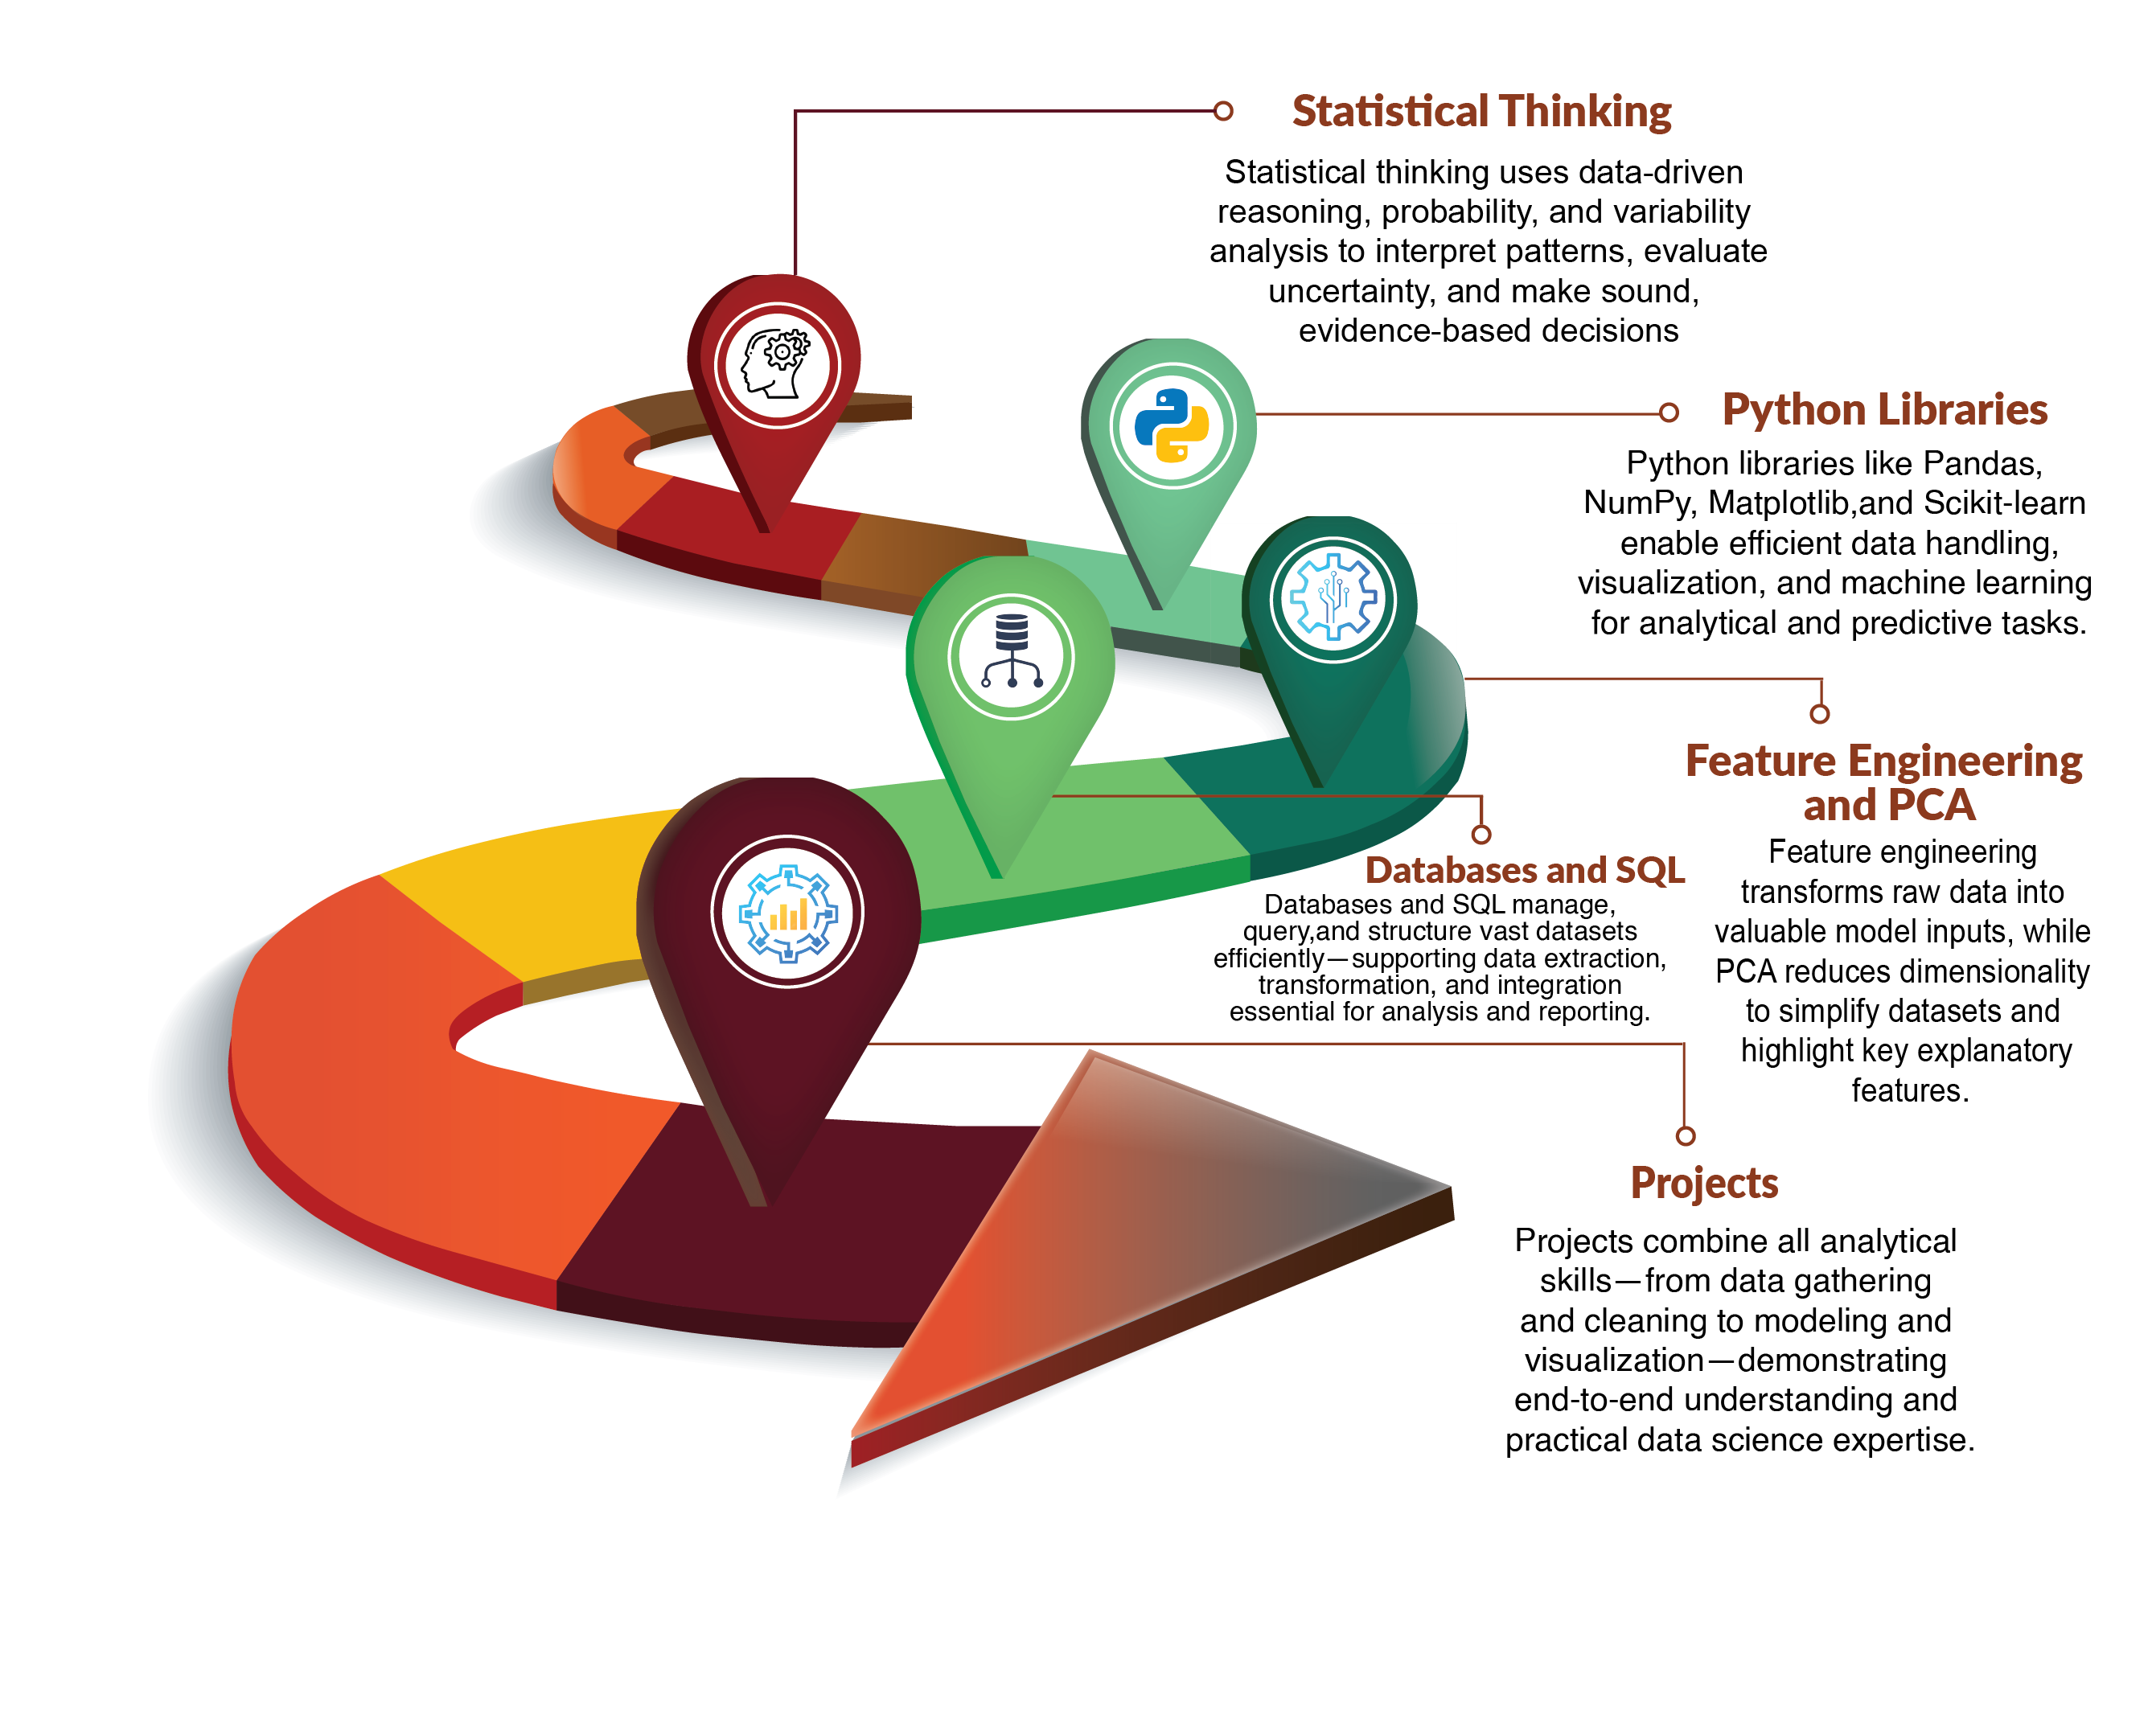
Introduction to Statistics
Types: Descriptive statistics and Inferential Statistics
Measures of Central Tendency: Mean, Median, Mode
Measures of Variability: Variance, Standard Deviation, Range, Quartiles, IQR
Outlier detection and treatment
Correlation and covariance
Cross-tabulations, frequency distributions, pivot tables
Introduction to inferential statistics concepts
14
Calculate descriptive statistics on real datasets
Visualize distributions using Matplotlib and Seaborn
Detect and treat outliers in datasets
15
Introduction to Probability
Basics of probability: Event, Sample space, Probability rules
Conditional probability and Bayes" theorem
Probability distributions
Discrete: Binomial, Poisson
Continuous: Normal, Uniform, Exponential
Sampling techniques: Probabilty and Non probability Sampling
Central Limit Theorem
Hypothesis testing concepts: Z-test, t-test, Chi-square, ANOVA (focus on probability background)
Confidence intervals and p-values (linking probability to inference)
16
Calculate probabilities for discrete and continuous distributions
Generate probability distributions using Python (numpy, scipy.stats)
Perform hypothesis tests based on probability concepts
17
Introduction to Exploratory Data Analysis (EDA)
Purpose of Exploratory Data Analysis
Understand the data
Detect anomalies
Discover patterns and relationships
Validate assumptions
Guide analysis decisions
Applications of Exploratory Data Analysis
Business & Retail
Finance
Healthcare
HR Analytics
Marketing
Methods to Perform Exploratory Data Analysis
Data Inspection
Univariate Analysis (Single variable)
Bivariate Analysis (Two variables)
Multivariate Analysis (Multiple variables)
Data Profiling
18
Inspect dataset structure and types
Check missing values and outliers visually
Visualize distributions and relationships
Generate mini reports with summary tables and charts
19
Feature scaling: Normalization and Standardization
Binning and encoding categorical data
Outlier treatment and data transformations
Derived columns and ratio features
Date and time-based feature extraction
20
Need for dimensionality reduction
Principal Component Analysis (PCA) for data exploration
Variance explained and feature contribution
Visualizing high-dimensional data in 2D/3D
21
Clean and prepare datasets for analytics reports
Create new features to improve insights
Apply PCA on a dataset to visualize clusters or patterns
Interpret principal components
22
Basics of Databases
SQL fundamentals (SELECT, WHERE, GROUP BY, JOIN)
Using SQLite or MySQL with Python (sqlite3, SQLAlchemy)
Reading/writing SQL queries from Python
23
Connect Pandas with SQL database
Perform CRUD operations
24
Automating data cleaning with Python scripts
Reading multiple files (CSV, Excel) and merging automatically
Using os, glob, and schedule for automation
Exporting processed data as reports (CSV, Excel, PDF)
25
Introduction to Data Ethics
What is data ethics and why it matters in analytics
Difference between legal compliance and ethical responsibility
Data Privacy & Confidentiality
Handling personal and sensitive data
Privacy regulations (overview)
Data Quality & Integrity
Ensuring accuracy, completeness, and consistency of data
Avoiding bias in data collection and processing
Ethical handling of missing or manipulated data
26
Bias and Fairness in Data Analysis
Introduction to Bias and Fairness
Identifying potential biases in datasets
Understanding ethical implications of biased analysis
Techniques to mitigate bias (balanced datasets, validation)
Responsible Reporting and Visualization
Avoiding misleading charts or selective reporting
Transparency in assumptions, calculations, and conclusions
Communicating uncertainty effectively
27
Audit a sample dataset for potential biases
Anonymize sensitive columns in a dataset using Python
Create visualizations while ensuring accurate and ethical representation
Discuss a case study where ethical violations in data analysis caused real-world issues
28
Retail Data Analysis - Identify sales trends and top products
HR Analytics - Explore employee turnover trends and demographics
Finance Analytics - Expense categorization and spending patterns
Healthcare Analytics - Analyze patient data and hospital statistics
COVID Data Insights - Time-series and country-level pattern analysis
Trinity Technologies in Trivandrum offers a comprehensive Data Analytics training and certification program designed to empower learners with the skills and insights needed to excel in today’s data-driven world. Suitable for both beginners and experienced professionals, the program covers core and advanced topics in analytics, including data visualization, statistical analysis, data mining, business intelligence, and predictive modeling. Led by industry experts, the course emphasizes hands-on, practical training, allowing participants to work with real-world datasets and tools used across the industry. Trinity Technologies stands as a trusted hub for aspiring data professionals, delivering a robust curriculum that prepares students to interpret data effectively, make informed business decisions, and thrive in diverse analytics roles across multiple sectors.
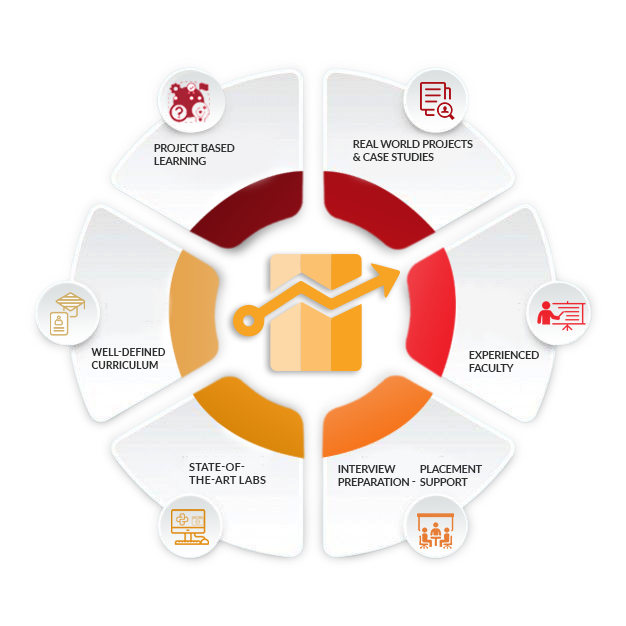
Trinity Technologies, located in the heart of Trivandrum, Kerala, is a leading institution in IT and emerging technologies training. The institute has earned a reputation for offering high-quality education that meets the latest industry standards. With a strong emphasis on hands-on learning, Trinity Technologies ensures that students not only understand theoretical concepts but also apply them in practical scenarios, making it an ideal choice for those looking to build a successful career in Data Analytics.
Trinity Technologies boasts a team of experienced instructors who are experts in the field of Data Analytics. These professionals bring a wealth of real-world experience to the classroom, helping students grasp complex analytics concepts with ease. The faculty at Trinity Technologies are not just teachers but mentors who guide students through every step of their learning journey, ensuring they are well-prepared for certification exams and real-world challenges.
At Trinity Technologies, students have access to state-of-the-art infrastructure, including the latest data analytics tools, software, and computing resources. The institute’s labs are equipped with high-performance systems and industry-standard analytics platforms that are essential for processing large datasets and building scalable analytical solutions. This hands-on experience is crucial for students to gain a deep understanding of how analytics is applied across industries.
The Data Analytics training program at Trinity Technologies covers a wide range of topics essential for mastering analytics. The curriculum is meticulously designed to align with current industry demands and includes:
Introduction to Data Analytics and Data Wrangling: Students learn the fundamentals of data analytics, data cleaning, preprocessing, and exploratory data analysis.
Statistics and Probability: Core statistical concepts, hypothesis testing, and inferential techniques used to draw meaningful conclusions from data.
Data Visualization and Dashboarding: Principles of effective visualization, hands-on work with tools like Tableau/Power BI (or open-source equivalents), and best practices for storytelling with data.
SQL and Databases: Querying relational databases, data modeling, and working with large datasets using efficient SQL techniques.
Programming for Analytics (Python/R): Practical programming skills for data manipulation, analysis, and automation using libraries such as pandas, NumPy, matplotlib, and tidyverse.
Predictive Modeling and Machine Learning Basics: Introduction to supervised and unsupervised learning, model evaluation, and selecting appropriate algorithms for business problems.
Business Intelligence and Decision Making: Translating insights into actionable recommendations, KPI design, and communicating findings to stakeholders.
Data Ethics and Governance: Best practices for handling sensitive data, privacy considerations, and ethical decision-making in analytics projects.
Capstone Projects: Students work on real-world data analytics projects, applying the skills they've learned to solve practical business problems and building a portfolio to showcase to potential employers.
Trinity Technologies emphasizes the importance of practical experience in its Data Analytics training program. The institute offers extensive hands-on labs where students work on live datasets, build analytical pipelines, and deploy dashboards in simulated real-world environments. This practical exposure ensures students are not just theoretically sound but also capable of implementing analytics solutions in professional settings.
To ensure students are well-prepared for certification exams and industry roles, Trinity Technologies conducts regular assessments and mock exams. These evaluations are designed to test students’ understanding of concepts and their ability to apply them. Detailed, constructive feedback from instructors helps students improve continuously.
Trinity Technologies is dedicated to helping students launch their careers in Data Analytics. The institute offers career guidance sessions covering resume building, interview preparation, and job search strategies. The placement cell collaborates with leading companies to connect students with internship and job opportunities, ensuring a smooth transition from training to employment.
A Data Analytics certification from a reputed institute like Trinity Technologies is a powerful validation of your expertise in analyzing, interpreting, and leveraging data for decision-making. It opens up diverse career opportunities and provides a competitive edge in the ever-growing job market. Here’s why earning a Data Analytics certification is important:
Industry Recognition: A Data Analytics certification is globally recognized and demonstrates your proficiency in one of the most sought-after skills across industries, from finance and healthcare to e-commerce and technology.
Career Advancement: Whether you’re starting your career or aiming to move up, a Data Analytics certification can significantly enhance your job prospects, salary potential, and credibility as a data-driven professional.
Foundation for Future Learning: Data Analytics serves as the foundation for advanced fields such as Machine Learning, Artificial Intelligence, and Data Science. Certification provides the knowledge base and confidence needed for continuous growth in data-related careers.
By choosing Trinity Technologies for your Data Analytics training, you are investing in a program that offers a perfect balance of expert instruction, practical experience, and comprehensive career support. The Data Analytics certification course at Trinity Technologies equips you with the technical skills, analytical mindset, and industry knowledge needed to thrive in today’s data-driven world — setting you on the path to a rewarding and successful career in Data Analytics.
What is Data Analytics Training?
Data Analytics training involves learning the tools, techniques, and methods used to collect, process, and analyze data to extract meaningful insights that drive informed business decisions.
Why Choose Data Analytics Training in Trivandrum?
Trivandrum is an emerging hub for technology and IT education, offering access to top institutes like Trinity Technologies. Students benefit from expert faculty, industry-relevant curriculum, and exposure to practical projects in a thriving tech ecosystem.
What are the Prerequisites for Data Analytics Training?
A basic understanding of mathematics, statistics, and computer operations is helpful. However, beginners can start with foundational modules designed to build essential analytical and technical skills from scratch.
What Topics are Covered in Data Analytics Courses?
Topics include data cleaning and preprocessing, SQL, Python or R for analytics, data visualization, statistical analysis, predictive modeling, business intelligence, and data ethics, along with hands-on projects using real datasets.
How Long Does a Data Analytics Course Take?
The duration varies depending on the depth of the course. A comprehensive Data Analytics program typically takes 3–6 months, covering both foundational and advanced topics with project-based learning.
What is the Job Market Like After Data Analytics Certification?
Data Analysts are in high demand across industries such as finance, healthcare, marketing, retail, and IT. Job roles include Data Analyst, Business Intelligence Analyst, Data Engineer, and Reporting Specialist, with strong career growth potential.
Trinity Technologies
Radheyam Tower
Gandhari Amman Kovil Road
Opp. Rajakumari Jewelry, Pulimood
Trivandrum, Kerala, 695001
Phone Numbers:
Email:
Monday - Saturday: 7:00 AM - 8:00 PM
Sunday: Closed
Batch Timings Available:
Morning | Afternoon | Evening